A method to perform an experiment for the Earth is described.
Following physical processes are used in this experiment.
This experiment requires data of distribution of sea surface temperature, surface properties, sea ice density, and ozone. So, the experiment is performed with the following 4 steps:
Move "practice" directory:
$ cd practice
In the directory, execute 'make' command. The execution files and the NAMELIST files will be automatically copied. Input directory name first of all after inputting 'make' command. (It is assumed "Earth-exp" in the following example). Input 'Enter' to the question after that.
$ make

****** Setup a directory for a experiment ******

  Enter directory name [testXX]: Earth-exp
  Directory in which executable files are prepared
    [../src/main]:
          :
Move the directory
$ cd Earth-exp
Note that you can perform an experiment in any directory by using executable files and configuration (namelist) files.
This experiment requires additional data, sea surface temperature, surface properties, sea ice density, and ozone distribution. Those data are prepared at following site.
Please download "sst_amipII_bc_clim_T021.nc", "sp_for_Earth_T021.nc", "sic_amipII_bc_clim_T021.nc", and "O3_CMIP5_climatology_zonalmean_T021.nc" from above site, and place those files at experimental directory.
At the last, run a experiment using "dcpam_main" and "dcpam_E_T21L22.nml". Resolution is T21L22, time step is 30 minutes. Integration time is 10 days. A restart data file, a restart data file of surface data, and some history data files are output.
$ ./dcpam_main -N=dcpam_E_T21L22.nml | tee Earth.log
If initial data, surface data, settings of experiments want to be changed, edit "init_data_T21L22.nml", "dcpam_E_T21L22.nml".
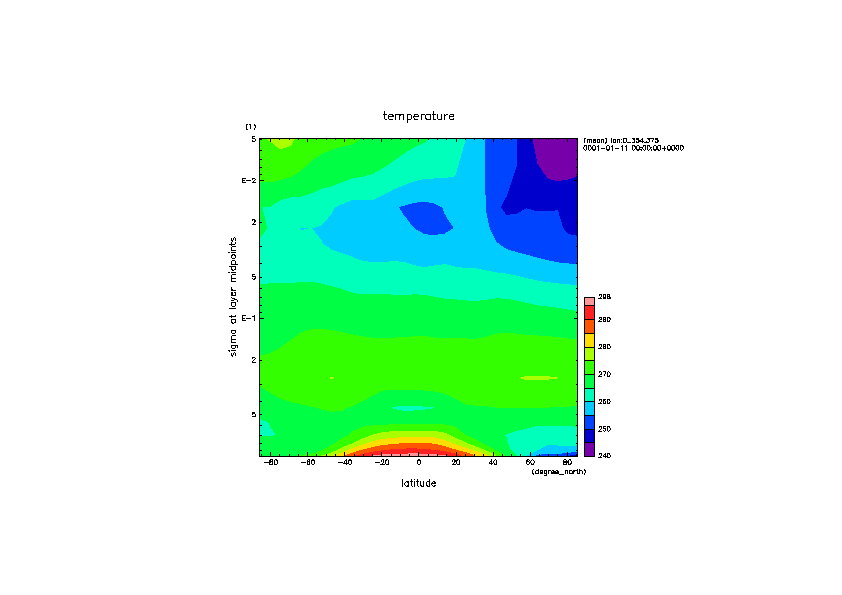
Zonal mean temperature distribution after integration for 10 days is shown below.
This figure is drawn by using Gphys, as follows:
Please type irb.

$ irb

Following prompt of irb is shown.

irb(main):001:0>

Type following lines. Please note that the left-most number is line number, and it has not been typed.

1: require "numru/ggraph"
2: include NumRu
3: gphys = GPhys::IO.open('Temp.nc', 'Temp')
4: DCL.gropn(1)
5: DCL.sgpset('lcntl', false) ; DCL.uzfact(0.7)
6: GGraph.set_fig( 'itr'=> 2 )
7: GGraph.tone( gphys.mean('lon').cut('time'=>10) )
8: GGraph.color_bar
9: DCL.grcls

Type quit to exit irb.
Above figure shows spin-up phase of the atmosphere, because the Earth's atmosphere does not reach quasi-equilibrium in 10 days.
